Contents
- Index
- Previous
- Next
Isotopic Profiler
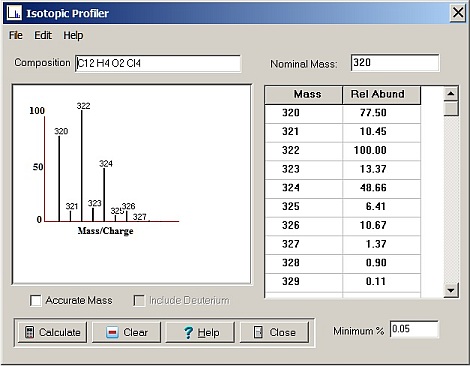
Isotopic Profiler is a sub-program available under the Utilities Menu. It will calculate and display isotopic profiles for an ion containing one or more polyisotopic atoms. If a structure is present on screen when Isotope Abundance is activated, the elemental composition of the structure will be entered into the formula box and automatically calculated. To enter a composition directly, type the elements and number of atoms into the formula box:
e.g. C2 H4 Br2
The elements can be added in any order, and the entry is case-insensitive; however, you must type a space between each element. Entries can be edited directly in the usual Windows manner.
Click on the 'Calculate' button to carry out the analysis. The isotope profile will be displayed as both a list of masses and relative abundancies normalized to the most abundant peak, and as a standard mass/intensity plot. Only those peaks with relative abundancies greater than the indicated cutoff are retained in the final results. The output from this calculation can be sent to the default printer by clicking on the 'Print' button. After completing a calculation, you can edit the elemental composition and recalculate, or click on New Ion to reset to the default (blank) conditions. Select Exit to return to the main program window.
The default minimum abundance for the display of 0.5% can to changed to any value in the range of 0.01 - 99% by entering the desired minimum value in the text box near the bottom of the window. To display a high-resolution profile based on accurate mass values select the Accurate Mass option box. Note that unlike the nominal resolution profile which is presented normally, the accurate mass values are spaced equally along the abscissa rather than being spaced according to mass difference. This is done to facilitate display of all masses on the plot regardless of mass resolution. Also note that there are additional limits on the number of polyisotopic species that can be handled in high-resolution mode. The program will notify you if the requested calculation would exceed those limits.
Results can be sent to the printer which will print both the mass / intensity plot and the table of values. The plot can also be copied to the Windows clipboard by selecting the Copy option under Edit.