Contents
- Index
- Previous
- Next
Tutorial 03 -- Isotopic Profile
Isotopic Profile is an option on the Utilities menu, and is also available as a Speedbutton on the Toolbar. This utility will calculate the theoretical profile for ions containing one or more polyisotopic species from the elements supported by MSC. The elemental composition can be entered directly in Isotopic Profile; a profile also will be created automatically for whatever structure is present on screen when the utility is opened. In this tutorial, you will first create a structure on screen, and then evaluate its profile:
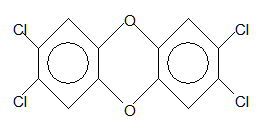
1 For this analysis, you need to draw a molecule of dioxin -- 2,3,7,8-TCDD. If a structure is present on screen, select File | New (or click on the X speedbutton) to remove it. Then select the cyclohexane ring [r1, c1] and draw a ring near the middle of the drawing region.
2 Select the benzene ring structure [r1, c2] and add (merge) rings to both sides of the central ring. Select the bonded chlorine structure [r7, c1] and click on the four lateral positions. Finally, select the O atom from the palette and click on the two linking carbon atoms. You should have the structure for dioxin at this point, C12 H4 O2 Cl4, MW = 320:
3 Click on the Utilities item on the main menu and select Isotopic Profiler (IP). If a structure is present on screen when IP is opened, the composition will be incorporated and processed automatically. Therefore, you should have the isotopic profile of dioxin visible on screen in both tabular and graphic form.
4 The elemental composition in IP can be edited and reprocessed at any time. Click in the composition window to create an insertion point, and type "br2". The entry can be placed anywhere, but it must be separated by at least one space from any other element. Click on the 'Calculate' button to recalculate the new composition.
5 The default minimum abundance is 0.5%. This can be changed to any value between 0.01 and 99%. Select the Minimum % value, and replace it by typing "0.01", then click 'Calculate'. An additional low abundance value will appear in the list and on screen.
6 To evaluate the 'High resolution' profile, click on (i.e. select) the 'Accurate Mass' option box, and then click on 'Calculate' again. In this case, the high resolution profile will be displayed. Note that because of the large dynamic range for accurate mass values, the graphical display is NOT displayed proportionally as it is in low resolution; rather, the high-resolution masses are simply spaced evenly along the abscissa.
7 If you click on the 'Print' command button, you will send a copy of both the tabulated and graphical results to the printer. Click 'Exit' to return to the main MSC screen.
Goto Tutorial #4
Return to QuickStart