Contents
- Index
- Previous
- Next
Spectrum Window
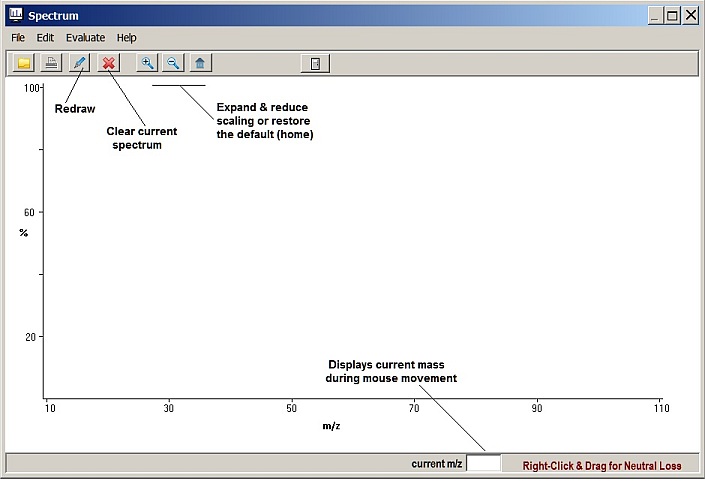
When Spectrum is first selected, a window will open displaying a set of axes. You can then choose File / Open or click the Speedbutton to load a spectrum file. The default spectrum files are in plain ascii with a .asc extension and consist of a mass intensity list with each entry on separate line. You can also load NIST .msp files by clicking the small down arrow at the right of the file selection box and select files with the .msp extension. It is sometimes possible to read ASCII mass-intensity files in other formats by using the Import options in Spectrum Editor. After a spectrum has been opened, it will be displayed in default format and additional menu and window options will be activated. If Spectrum has been called from Autofragment, then Compare options will also be shown at the bottom of the window, as will additional menu items.
When a spectrum is loaded the main ions will be labeled automatically. You can label additional ions if you wish by <Shift>-clicking on a peak with the left mouse button. Clicking on any peak with the left mouse button (without holding the Shift key) will popup the Elemental Formula window that can be used to evaluate possible compositions for that mass. By default only Carbon and Hydrogen will be selected; you can select additional atoms and other restrictions in the Elemental Formula window as desired and recalculate.
However, if a structure is present on the main drawing window, then the appropriate elements for that structure will be pre-selected along with the maximum values for each element when the Element Composition window appears. This will be indicated on the Elemental Composition window by a "Constrained" notice. If you are working with Spectrum and find that NO composition can be found for a fragment, then there is probably an incorrect structure present on screen with the Constrained option in effect, and no match is possible with the presently selected atoms and limits. However, if you are certain that both the structure and spectrum are correct, then other possibilities include a doubly charged ion if the mass is 1/2 the molecular mass, or a contaminant peak in the spectrum.
Clicking the Right mouse button on a peak and dragging to a higher mass peak such as the molecular ion will popup a Neutral Loss window showing the mass difference and possible neutral losses commonly associated with that mass. To make certain that you are picking the correct peaks for both the first and second ion peaks, you can monitor the Current mass value listed at the bottom of the screen while selecting and dragging the mouse.
In summary: <Shift> Left Click = label the peak
Left Click (no shift) = show possible elemental compositions for the mass
Right Click and drag = calculate possible neutral loss